When the Sun acts up, NOAA’s Space Weather Prediction Center (SWPC) puts out alerts full of codes: G3, Kp 7, S1, R2, “watch,” “warning.” They look technical, but they follow a simple system. This guide explains what each one means, how to tell whether the northern lights might reach you, and which two NOAA forecast pages to check.
The three NOAA space weather scales: G, S and R
NOAA introduced its space weather scales to tell the public about current and future conditions and their possible effects on people and systems. SWPC says the scales cover three event types, geomagnetic storms (G), solar radiation storms (S) and radio blackouts (R), with numbered levels “analogous to hurricanes, tornadoes, and earthquakes.” Each scale runs from 1 (minor) to 5 (extreme).
G scale: geomagnetic storms (the one aurora watchers care about)
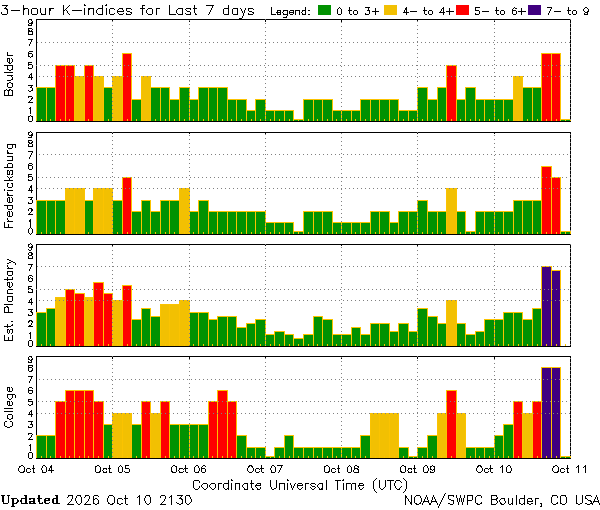
The G scale is tied directly to the Kp index. Here’s how SWPC lines them up, with the place where aurora “has been seen as low as” at each level:
- G1 (Minor), Kp 5: aurora commonly visible at high latitudes (northern Michigan and Maine). About 1,700 per 11-year solar cycle.
- G2 (Moderate), Kp 6: aurora seen as low as New York and Idaho (typically 55° geomagnetic latitude). About 600 per cycle.
- G3 (Strong), Kp 7: aurora seen as low as Illinois and Oregon (typically 50°). About 200 per cycle.
- G4 (Severe), Kp 8, including a 9-: aurora seen as low as Alabama and northern California (typically 45°). About 100 per cycle.
- G5 (Extreme), Kp 9: aurora seen as low as Florida and southern Texas (typically 40°). About 4 per cycle.
Higher levels can also affect power grids, satellites, GPS and high-frequency (HF) radio. At G3, for example, SWPC lists possible voltage corrections on power systems, more drag on low-Earth-orbit satellites, and intermittent satellite navigation problems. You can see a real example in our coverage of the G3 storm on Oct. 10, 2026.
S scale: solar radiation storms
The S scale measures the flux of high-energy protons (10 MeV and up). At S1, SWPC lists no biological or satellite effects, only minor impacts on HF radio in the polar regions. By S3 and above, the risks are to astronauts on spacewalks, passengers and crew in high-flying aircraft at high latitudes, and satellites. For people on the ground, an S storm doesn’t mean better aurora.
R scale: radio blackouts from solar flares
The R scale is set by the X-ray strength of solar flares: R1 starts at an M1 flare, R2 at M5, R3 at X1, R4 at X10 and R5 at X20. The effect is on HF radio on the sunlit side of Earth. At R1 it’s a weak or minor degradation, and at R5 there’s a complete HF blackout across the sunlit side lasting a number of hours. R events don’t cause aurora by themselves.
The Kp index explained: what Kp values mean for the northern lights
SWPC describes the K-index as a measure of disturbances in the horizontal part of Earth’s magnetic field over a three-hour period, on a scale of 0 to 9. A value of 1 is calm, and 5 or more means a geomagnetic storm. The planetary version, Kp, averages K values from observatories around the world. SWPC’s estimated Kp uses magnetometers in places such as Alaska, Canada, Virginia, the UK, Germany and Australia.
SWPC’s aurora viewing tips give a rough guide:
- Kp 0–2: the aurora stays far north, dim and not very active.
- Kp 3–5: it moves farther from the poles, gets brighter and more active.
- Kp 6–7: quite bright and active; it might be visible from the northern edge of the United States.
- Kp 8–9: very bright and very active, and may be seen overhead in the northern states.
SWPC also gives a rule of thumb: at Kp 0, the equatorward edge of the auroral oval sits around 66° geomagnetic latitude, and it moves about 2° toward the equator for each step of Kp, reaching about 48° at Kp 9. Two cautions from SWPC: those numbers are averages, and they’re in geomagnetic latitude, not the latitude on your map. SWPC notes the north magnetic pole currently sits in the islands of northeast Canada, about 400 km from the geographic pole.
Space weather alerts: watch vs. warning vs. alert
SWPC says it issues alerts, watches and warnings “similar to the bulletins put out by the NWS local forecast offices.” For the K-index, SWPC defines them this way:
- Watch: issued when the highest predicted Kp for a day is 5, 6, 7 or 8 or more, stated in terms of the G scale. In plain terms: a storm is forecast for that day.
- Warning: issued when Kp of 4, 5, 6 or 7 or greater is expected, closer to the event.
- Alert: issued when the estimated Kp reaches 4, 5, 6, 7, 8 or 9. It’s happening now.
So a “G3 watch” for tomorrow is a forecast, not a promise. A “Kp 7 alert” means the strong storm level has actually been reached.
Solar flares vs. CMEs: what causes a G3 storm
These two get mixed up, and they behave very differently.
A solar flare is a burst of electromagnetic radiation from the Sun lasting minutes to hours. It travels at the speed of light, so SWPC says any effect on the sunlit side of Earth’s upper atmosphere happens at the same time the flare is seen. That’s what drives R-scale radio blackouts.
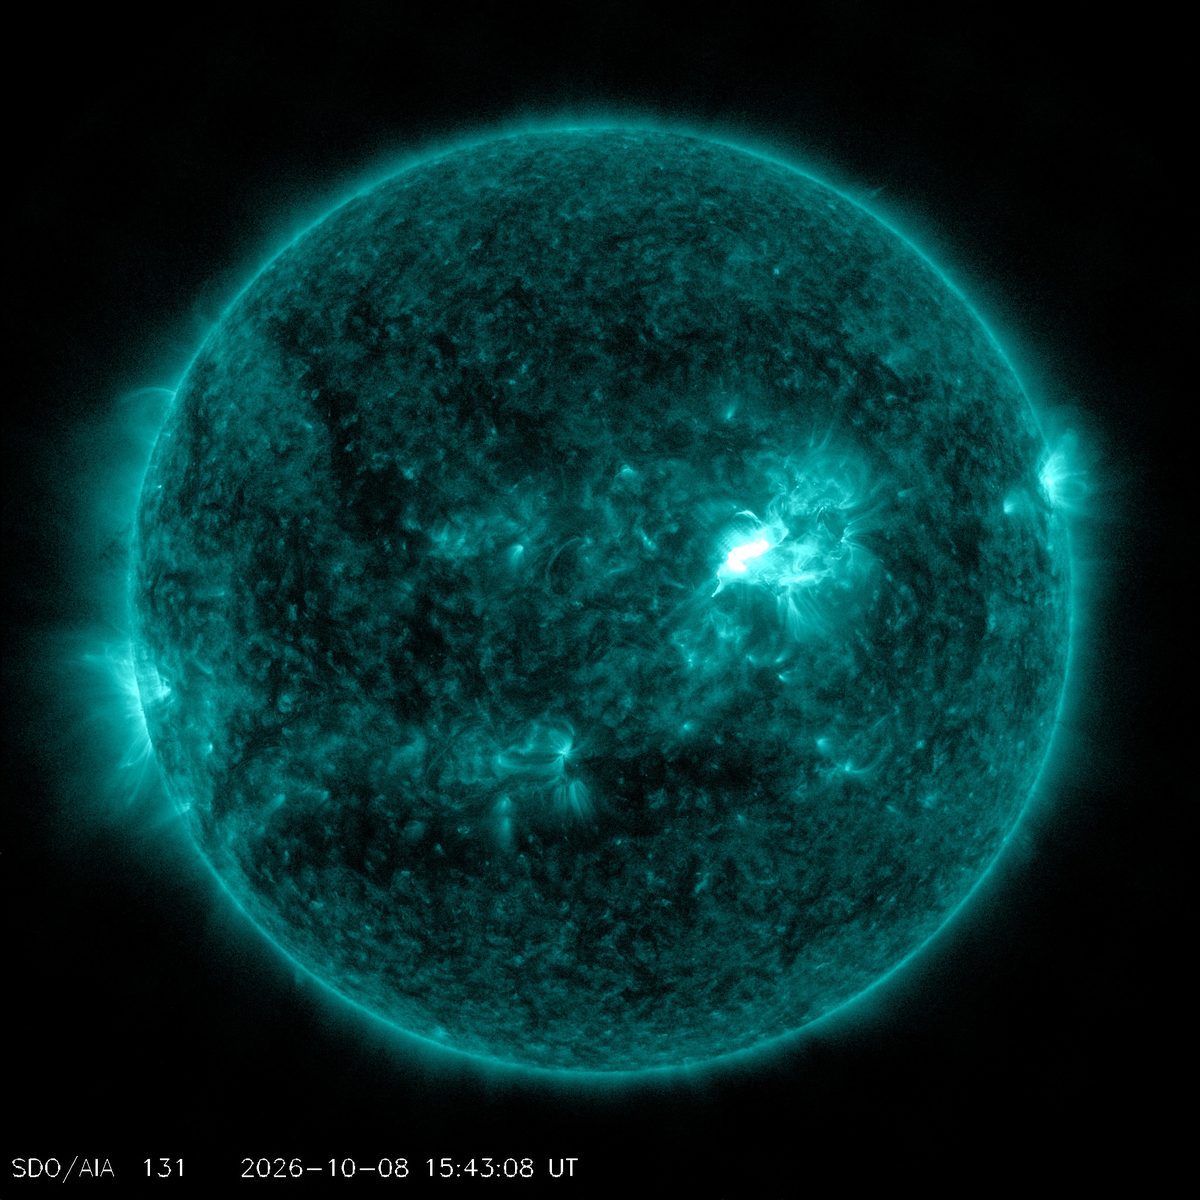
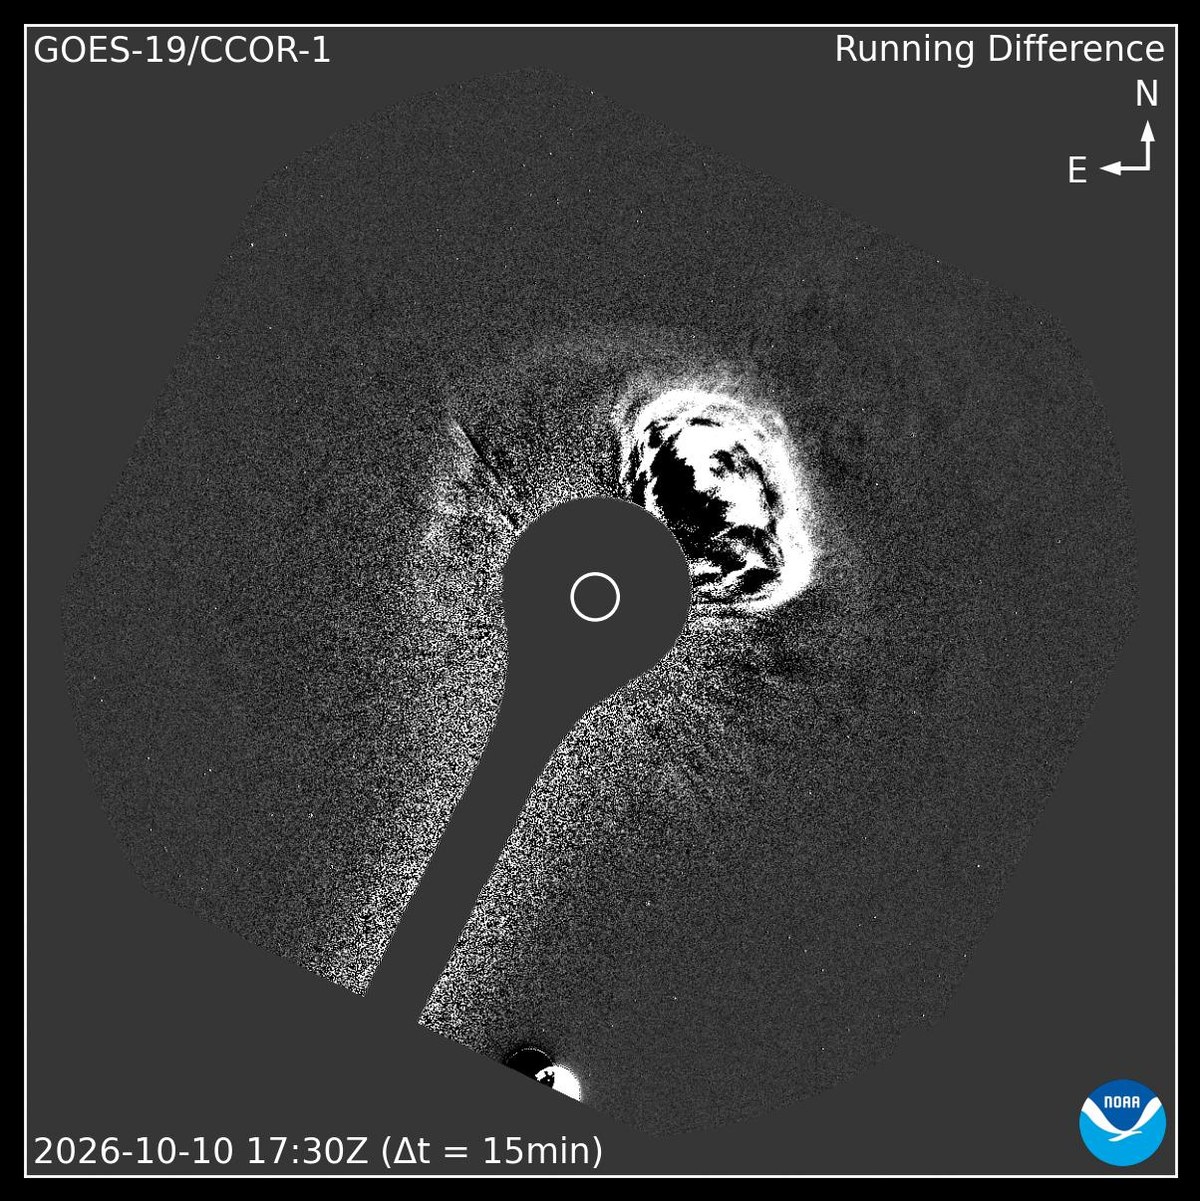
A coronal mass ejection (CME) is a large expulsion of plasma and magnetic field from the Sun’s corona. SWPC says CMEs travel at speeds from under 250 km per second to nearly 3,000 km per second. The fastest Earth-directed ones can arrive in as little as 15 to 18 hours, and slower ones take several days. When a CME hits Earth, SWPC says it can produce some of the biggest geomagnetic storms and the brightest auroras. SWPC notes that the more explosive CMEs are typically accompanied by a solar flare. We walked through one of these sequences in our story on the M6.7 flare and the weekend storm.
A third source is a coronal hole. SWPC says these send out high-speed solar wind streams that can cause moderate storms and active aurora, though less intense than the biggest CMEs.
How to use NOAA’s northern lights forecast (the 30-minute aurora map)
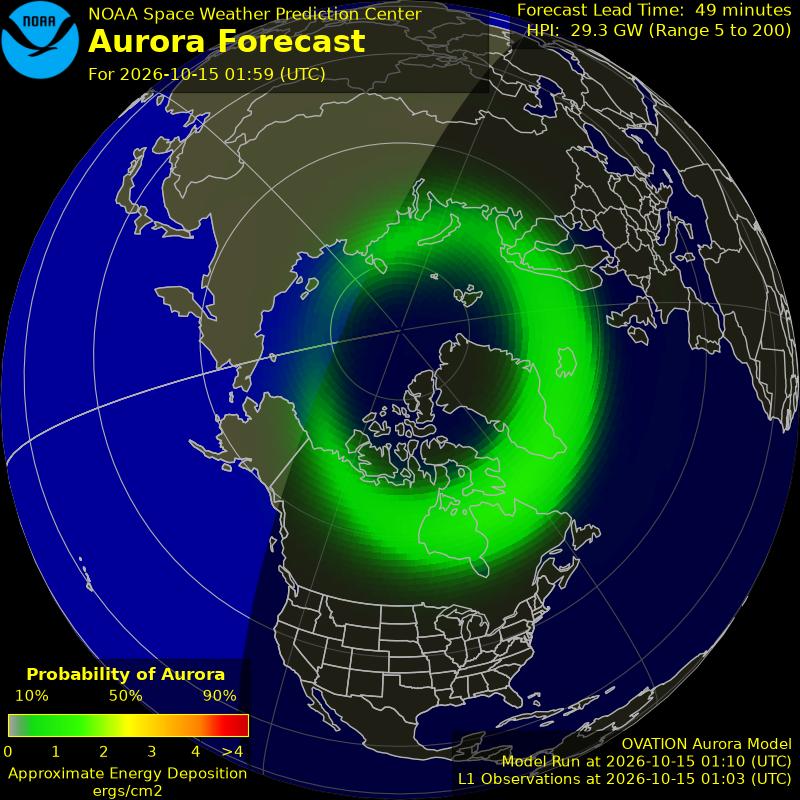
SWPC’s Aurora – 30 Minute Forecast is a short-term forecast based on the OVATION model, covering 30 to 90 minutes ahead. The lead time is how long it takes the solar wind to travel from a monitoring point about 1.6 million km (1 million miles) upstream of Earth.
- Read the oval: the aurora shows up as a green oval around the magnetic pole. SWPC says it turns red where the aurora is forecast to be more intense.
- Check day and night: the lighter-colored part of the map is in daylight, where you can’t see aurora.
- You don’t need it overhead: SWPC says a bright aurora can be seen from as far as 1,000 km away when conditions are right.
- Watch for a caveat: if solar wind data are missing, the model falls back on the current Kp and there’s no forecast lead time.
How to read the NOAA 3-day space weather forecast
The 3-Day Forecast is SWPC’s one-page plain-text summary. It’s issued every 12 hours, at 0030 and 1230 UTC (8:30 p.m. and 8:30 a.m. Eastern during daylight time), and it covers all three NOAA scales.
- Section A, geomagnetic activity: the greatest observed Kp in the past 24 hours, the greatest expected Kp for the next three days, and a table of expected Kp for each three-hour block. The blocks are in UTC, so convert to your time zone. Look for any block at 5 or higher, which is storm level.
- Section B, solar radiation: the chance of S1 or greater each day.
- Section C, radio blackouts: the chance of R1–R2 and R3 or greater.
- Rationale: each section ends with a short note from the forecaster explaining why. It’s often the most useful line.
Northern lights viewing tips
Taken from SWPC’s aurora pages:
- Go dark. Get away from city lights. A full moon makes the aurora look dimmer.
- Look toward the pole. In the Northern Hemisphere, find a spot with a clear view to the north, ideally from a hilltop.
- Time it. The best aurora is usually within an hour or two of midnight, between 10 p.m. and 2 a.m. local time. That window widens during stronger storms.
- Mind the season. Larger storms tend to happen near the spring and fall equinoxes. In summer at high latitudes, it doesn’t get dark enough.
- Check the sky. The aurora forms 80 to 500 km above the ground, so you need clear, cloud-free skies to see it.
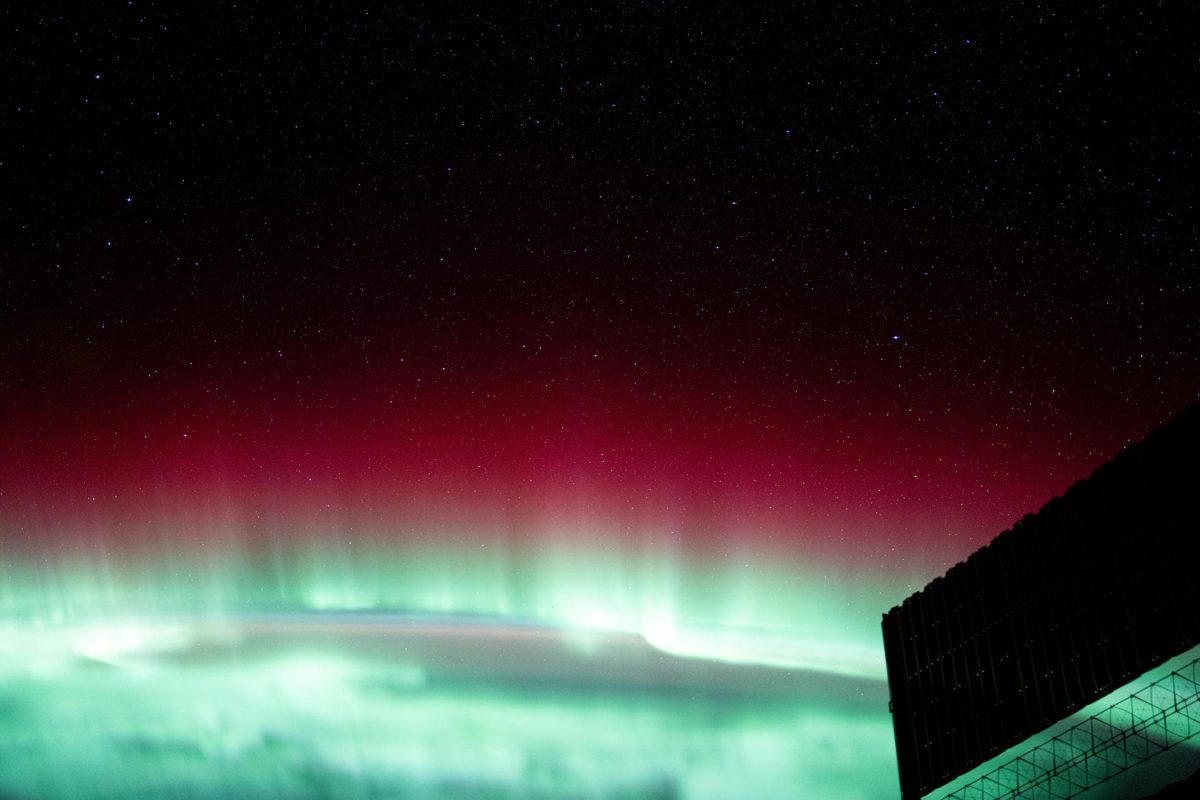
When a storm is on the way, our northern lights tonight page tracks NOAA’s latest forecast.
Quick reference
- G1–G5 = geomagnetic storm (Kp 5 to 9). This is the aurora scale.
- S1–S5 = solar radiation storm. Matters most for astronauts, polar flights and satellites.
- R1–R5 = radio blackout from a flare (M1 to X20). Sunlit side only.
- Watch = forecast. Warning = expected soon. Alert = happening now.
No Ground. Stay curious.